Firstly, I collected from each person the number of Smarties that they have according to color. There are pink, blue, yellow, green, red, brown and purple.
Secondly, based on the data collected, I knew the exact amount of each colour and I drew a bar graph on the magic board.
Finally, I was able to make some interpretation such as green and red colour have the most amount of all the colour and pink is the fewest. Whereas, blue and purple share the same amount.
Probability is the number of ways that an event can occur.
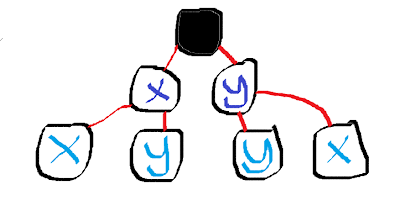
An example of probability. At the end, all has the same probability to reach which is 1.
(A) X-X (B) X-Y (C) Y-Y (D) Y-X
This second example display how at the end they have a different probibility.
(A) X-X (B) X-Y, Y-Y (C) Y-X
(I regret that I did not capture even one photo of what I had done in the workshop. )


0 comments:
Post a Comment